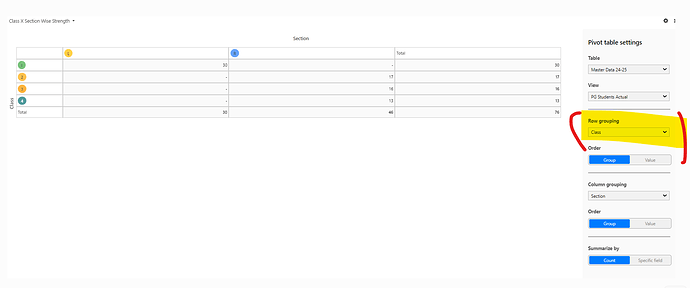
How can I set up a pivot table with many rows that reflect the student strength by class and section, with the admission numbers tallied in columns?
Similar to Excel’s Pivot Table capabilities, Stackby’s pivot table feature does not permit the presentation of numerous rows as headings. However, you can use the Grouping Records tool to achieve a similar result. Here’s how you can do it:
Using the Grouping Records Tool to Display Student Strength by Class and Section
-
Group Data by Class and Section:
- Go to your data table in Stackby.
- In the toolbar, select the Grouping Records option.
- First, group your data by the Class column.
- Then, add a second grouping criterion for the Section column.
-
View Student Strength:
- This will arrange your data into collapsible groups based on Class and Section.
- You can expand each group to see the students within each Class and Section.
- The total number of students in each grouping will be visible, providing a clear view of student strength.
Although this approach is not a conventional pivot table, it offers a practical workaround for displaying student strength by class and section in Stackby. For more details, you can refer to the Stackby help article on grouping records

